


County schools ‘ace’ State Report Card
DAVE MOSIER/independent editor
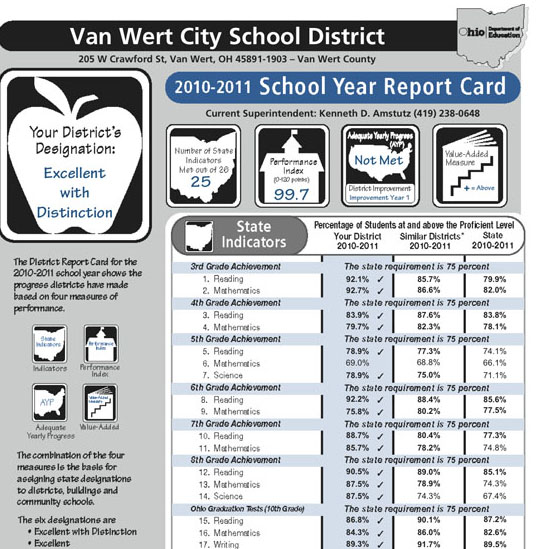 The three Van Wert County school districts received an affirmation of their efforts to provide a quality education to local students when all received “excellent” rankings on the State Report Cards released Wednesday by the Ohio Department of Education. It was the first time all three districts had earned the excellent ranking at the same time — and the first-ever districtwide excellent ranking for Van Wert City Schools.
Like Van Wert, Crestview and Lincolnview local school districts both earned “excellent” rankings, while Van Wert garnered the highest ranking possible, “excellent with distinction,” something less than 15 percent of Ohio school districts receive.
Superintendents of the county districts were pleased with their State Report Card rankings, which included all three districts meeting 25 of the possible 26 state indicators. All three districts fell down on one math standard, with Crestview (narrowly) and Van Wert fifth-graders failing to meet the state math indicator and Lincolnview eighth-graders missing the 75-percent math score cut-off, but not by much.
“It’s very exciting for our school district,” said Van Wert Superintendent Ken Amstutz. “That’s part of the work we’ve been doing the past three years with our district leadership team and our building leadership and being involved in the Ohio improvement process, and this is kind of the fruits of that labor.”
Amstutz said the value-added component of the State Report Card is a crucial part of the educational process in the city school district (click here for the full district report card for Van Wert).
“Value-added is really what we should be doing: making sure each child has the correct amount of growth,” he noted. “That’s something we’ve been working hard to do and it’s hopefully paid off.”
“It’s really a tribute to the hard work all of our people have put in,” Amstutz said, adding that the top ranking is a “feather in the cap of all of our employees … and our community.”
All three districts at least met the value-added requirement of the State Report Card ranking, but Van Wert was the only district to exceed the value-added minimum standards.
“Now the challenge is to stay there,” Amstutz said, adding that teachers and staff would continue to work hard to maintain the school district’s educational standards.
The only sour note in Van Wert’s ranking was its continued failure to meet the Adequate Yearly Progress (AYP) standard — but that standard is difficult for the district to meet because of Van Wert’s relatively large population of students with disabilities.
Crestview Superintendent Mike Estes was very pleased that his district returned to the excellent designation after struggling a bit last year with the Value-Added portion of the program, which dropped the district two levels to the “continuous improvement” ranking.
Estes gave a lot of credit for the turnaround to the PRIDE Committee headed by Elementary Principal Kathy Mollenkopf, but said the entire Crestview community deserved at least some of the credit for the district’s return to excellence (click here for Crestview’s full district report card).
“We worked hard and put it all together this year,” the Crestview superintendent said of the efforts made this year in connection with the State Report Card criteria.
Lincolnview Superintendent Doug Fries was also very pleased with his district’s second straight “excellent” ranking — and third in six years (click here for Lincolnview’s full district report card).
“We feel pretty good about being rated ‘excellent’ or higher three of the last six years,” Fries said, who said the district’s failure to exceed the value-added portion of the rankings was the reason it did not receive the “excellent with distinction” ranking.
“I’d like to commend the students, staff, parents, community, administration … everybody’s ongoing effort to establish an outstanding academic report card and really make academics a priority,” Fries said. “I thank all of them for their dedication.”
Statewide, Ohio’s students continue to show steady improvement in their academic performance, but will face higher expectations in coming years as learning standards increase, State Superintendent Stan Heffner said Wednesday in releasing the 2010-2011 State Report Card. “We want to build on the strong academic progress we are making as we move to a more rigorous set of standards that will better prepare Ohio graduates to be college or career ready,” Heffner said. “All Ohioans should be proud of the hard work our students, educators and parents and guardians have undertaken to improve performance.” The percentage of students scoring proficient on state tests increased on 21 of 26 indicators, with the strongest gains in third-grade math, eighth-grade math and 10th-grade writing. Overall, students met the state goal on 17 out of 26 indicators, one less than last year. The statewide average for all students’ test scores, known as the Performance Index, jumped 1.7 points to 95, the biggest gain since 2004-2005. For 2010-2011, the number of districts ranked Excellent with Distinction or Excellent increased by 56 to 352. The number of schools in those same categories grew by 186 to 1,769. Last year, the State Board of Education adopted the Common Core Standards in English language arts and mathematics, as well as the revisions to Ohio’s Academic Content Standards in science and social studies. The standards will take effect in 2014-2015, when a new generation of online assessments will be implemented. The recently passed state budget also included language that calls for a new system to rank schools and districts for accountability and to help school leaders identify best practices. “We are going to be increasing expectations with a more rigorous system to ensure we are competitive with the world,” Heffner said. State and Local Report Cards measure the performance of districts and schools using four measures, including the state indicators drawn from academic tests. Other measures include:
Value-Added results, which show whether students meet the expected one year of growth for students in grades 3-8 in reading and math. In 2010-2011, 79.5 percent of districts and 81.4 percent of schools met or exceeded expected Value-Added gains.
The Performance Index looks at the performance of every student, not just those who score proficient or higher. In 2010-11, 89.3 percent of districts and 71 percent of schools improved their Performance Index scores.
Adequate Yearly Progress (AYP) is a federally required component that measures achievement of each student subgroup, including racial and ethnic components. Half of districts (50.6 percent) and nearly 60 percent of schools met AYP in 2010-2011.
The 2010-2011 Report Card also includes two graduation rate measures. The new method more closely tracks when students transfer to or from a school and will replace a previous method that estimated graduation rates. The different method — required by federal law — is provided for information only and will not factor into school and district rankings until the 2011-2012 Report Card. It shows an on-time graduation rate of 78 percent statewide, compared with 84.3 percent using the existing formula.
Go to www.reportcard.ohio.gov to read the full State Report Card, along with district and building report cards.
POSTED: 08/25/11 at 5:17 am. FILED UNDER: News