


2018 State Report Card findings released
DAVE MOSIER/independent editor
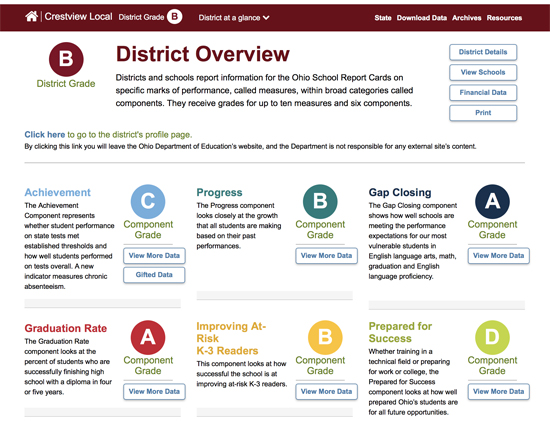
The Ohio Department of Education released its 2018 Ohio School Report Cards on Thursday, with this year’s edition providing an overall district grade, as well as grades for six separate components: Achievement, Gap Closing, K-3 Literacy, Progress, Graduation Rate, and Prepared for Success.
 As has been the case the past several years, a number of education experts have noted that the test results are skewed in favor of districts with a lower number of disadvantaged students.
“Today’s state report card data shows that a disturbing pattern continues,” said Dr. Howard Fleeter of the Ohio Education Policy Institute. “Economically disadvantaged students continue to perform far worse than non-economically disadvantaged students on all measures.”
These results, Fleeter added, track with the recent study of the state’s school-funding efforts since the landmark Ohio Supreme Court DeRolph decision, which found disparities for low-wealth districts continue to exist two decades later.
“Districts whose Performance Index is below 70 have an average of 88.1-percent economically disadvantaged students and districts who performance index is above 100 have an average of only 11 percent economically disadvantaged students.”
Results for Van Wert County schools would seem to match up with that assessments, as Crestview and Lincolnview districts, which have lower numbers of disadvantaged students, did better on the assessment than Van Wert City Schools, which has a proportionally higher percentage of disadvantaged students.
Although Crestview’s report card was the best of the three districts, with mostly A’s and B’s and an overall grade of B, it did receive a D in the Prepared for Success component, as did Van Wert and Lincolnview. However, the movement toward career education, and the fact that fewer students are attending four-year colleges, opting instead for vocational schools and community colleges, makes the component seem less relevant, since it mostly deals with information such as Advanced Placement test participation and ACT and SAT scores — both areas more related to four-year college attendance.
The good news for all three districts is that all three received an A on the graduation rate component, with Van Wert and Lincolnview graduating 100 percent of students in a five-year period, while Crestview graduated 98.2 percent of students in five years.
Crestview and Lincolnview both received a B for their overall district grade, while Van Wert had an overall district grade of D.
Lincolnview was the only district of the three to receive an A on the Progress component of the report card, which looks closely at the growth of all students in a district. Crestview received a B on that component, while Van Wert received a D.
Both Crestview and Lincolnview received a C on the Achievement component, which shows student performance on state tests and testing overall. Van Wert again received a D on that component, which most negatively affects districts with higher numbers of economically disadvantaged students.
Crestview had a B in the K-3 Literacy component, which tracks how well school districts are doing to improve at-risk K-3 readers. Van Wert scored a C on that component, while Lincolnview had a D in that category.
On the Gap Closing component, which purports to show how districts meet performance expectations for their most vulnerable students in English language arts, math, graduation, and English language proficiency, Crestview received an A, while Lincolnview was given a B, and Van Wert, with the most such students, earned a D.
Report card scores for each district and each component are as follows:
- Overall district grade: Crestview and Lincolnview B, Van Wert D
- Achievement: Crestview and Lincolnview C, Van Wert D
- Progress: Lincolnview A, Crestview B, Van Wert D
- Gap Closing: Crestview A, Lincolnview B, Van Wert D
- Graduation Rates: All three school districts A
- Improving At-Risk K-3 Readers: Crestview B, Van Wert C, Lincolnview D
- Prepared for Success: All three districts D.
Lincolnview Superintendent Jeff Snyder, who emailed a response to the report card results, noting that while district officials were “very satisfied in a number of areas” with the results, the district would continue to work on improving state report card scores.
“Also, while we celebrate the product of student learning, which is reflected in the state report card results, we must always focus on the process of learning,” Snyder added. “We have also concentrated on the need to enhance, enrich, and empower our students in areas that the report card does not reflect, or even evaluate, such as school pride, a community-centered focus, serving and leading, and a career connection of employability and college readiness.”
Officials in all three districts will likely review the results and work on areas where they didn’t perform as well as they would have liked.
POSTED: 09/14/18 at 8:05 am. FILED UNDER: News