







Saunier shares local winter outlook
By Matt Saunier/Van Wert County EMA Director
The question over the last few weeks has been “What will winter be like with a Super El Nino?” To most, “Super El Nino” sounds ominous, but we should keep in mind that “Super” in that term is not an accepted scientific term in the atmospheric science community. Super El Nino was a term coined in the early 2000’s to depict the strength of the current El-Nino Southern Oscillation. NOAA officially categorizes the strength of such conditions as “Very Strong El Nino.”
While the terminology is largely semantics, it sounds a bit more aggressive than it really is, especially for our area of the globe.
El-Nino Southern Oscillation (ENSO) is a periodic fluctuation in sea surface temperatures and atmospheric pressure in the equatorial Pacific Ocean that drives global weather and rainfall. (National Centers for Environmental Information) A Very Strong El-Nino is in place when El-Nino region 3.4 surpasses 2°C+ temperature departure from normal. Currently, this region is at a 2.5°C departure.
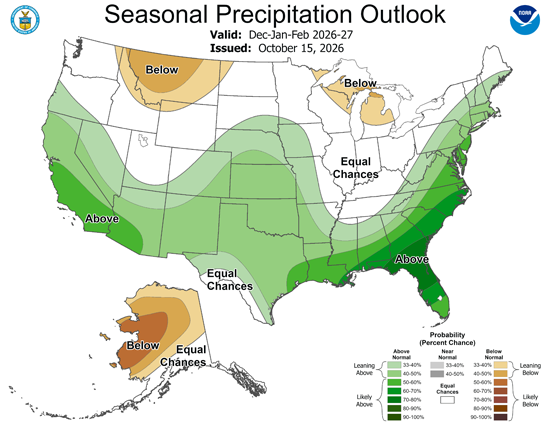
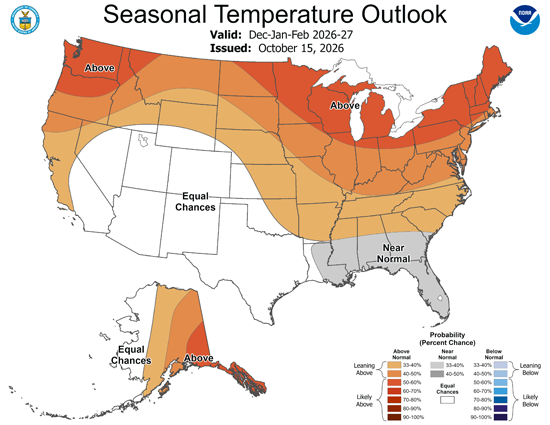
Looking towards winter time, the Climate Prediction Center (CPC) has published their winter outlook (see maps below). Overall, the temperature outlook leans above normal while the precipitation outlook stays consistent with equal chances of above normal and below normal accumulation of precipitation.
“What is the average temperature and precipitation for Van Wert?”
I’m glad you asked! Looking at the 2 charts below pulled from (https://www.weather.gov/wrh/Climate?wfo=iwx) we see that the average temperature for Van Wert over the winter months (January-March) dating back to 1991 is 30.7°F and precipitation is 2.36″. Do understand that this precipitation is not the equivalent to snowfall, we’ll get to that in a second.
Climate history shows us that there have been several Very Strong El-Nino’s. The most recent have taken place in 1992-1992, 1997-1998 and 2015-2016. Here is some data from each of those winters:
Average Temperature:
1991-1992
December: 40.4°F
January: 35.0°F
February: 41.3°F
1997-1998
December: 37.3°F
January: 38.1°F
February: 44.9°F
2015-2016
December: 47.7°F
January: 33.2°F
February: 40.7°F
Cumulative over the 3 events:
December: 41.8°F
January: 35.4°F
February: 42.3°F
Average temperature over all 3 months: 39.8°F
Snowfall:
1992 – 15.3″
1998 – 0″
2016 – 4.2″
As you can see, there have not been a tremendous amount of severe conditions that rise to the level of “Super” in our average weather during a Very Strong El Nino. Of course, this doesn’t mean that we won’t see snowfall or cold temperatures. You will see that there were still low temperatures in the single digits and days with good snowfall, but I want to iterate that the impact of the “Super” El Nino doesn’t always mean doom and gloom for our area.
POSTED: 10/26/26 at 10:06 pm. FILED UNDER: News